4QFY2018 Result Update | Automobile
May 30, 2018
Mahindra & Mahindra Ltd.
BUY
CMP
`868
Performance Update
Target Price
`1,050
Y/E March (` cr)
4QFY18
4QFY17
% yoy
3QFY18
% qoq
Investment Period
12 months
Net sales
13,308
12,048
10.5
11,578
14.9
EBITDA
1,754
870
101.6
1,494
17.4
Stock Info
EBITDA margin (%)
13.2
7.2
596
12.9
28
Sector
Automobile
Market Cap (` cr)
1,11,340
Adjusted PAT
1,059
622
70.2
1,216
(12.9)
Net Debt (` cr)
2,900
Source: Company, Angel Research
Beta
0.8
For 4QFY2018, M&M posted good set of results, exceeding our expectations on
52 Week High / Low
901/612
both, top-line as well as bottom-line fronts. Revenues grew by ~10% yoy. On the
Avg. Daily Volume
93,271
bottom-line front, M&M reported growth of ~70% yoy to `1,059cr on the back of
Face Value (`)
5
strong top-line growth and operating margin improvement.
BSE Sensex
34,906
Nifty
10,430
Top-line driven by strong volume growth: The company’s top-line grew by ~10%
Reuters Code
MAHM.BO
yoy to `13,308cr on the back of strong growth in farm equipment segment and
Bloomberg Code
MM.IN
others segment. Farm Equipment segment grew by ~33% yoy during the quarter,
whereas others segment reported a growth of ~31% yoy. Moreover, positive rural
Shareholding Pattern (%)
sentiments and government push for infra & construction projects are the other
Promoters
21.7
key deliverables which also boosted the company's growth. However, Automobile
MF / Banks / Indian
9.7
segment ~grew by mere 3%.
FII / NRIs / OCBs
33.2
Indian Public/Others
35.4
Profitability driven by strong revenue growth and lower interest: On the operating
front, the company’s margin strengthened by 596bps to 13.2%. Moreover, M&M
Abs.(%)
3m
1yr
3yr
reported ~70% yoy rise in its net profit to `1,059cr on the back of strong top-line
Sensex
7.3
27.7
30.0
growth as well as lower interest and depreciation costs.
M&M
19.5
22.8
38.3
Outlook and Valuation: We expect M&M to report net revenue CAGR of ~13% to
~`62,235cr over FY2018-20E mainly due to healthy growth in automobile
segment like Utility Vehicles (on the back of new launches and facelift of some
models) and strong growth in Tractors segment driven by strong brand recall and
improvement in rural sentiment. Further, on the bottom-line front, we expect
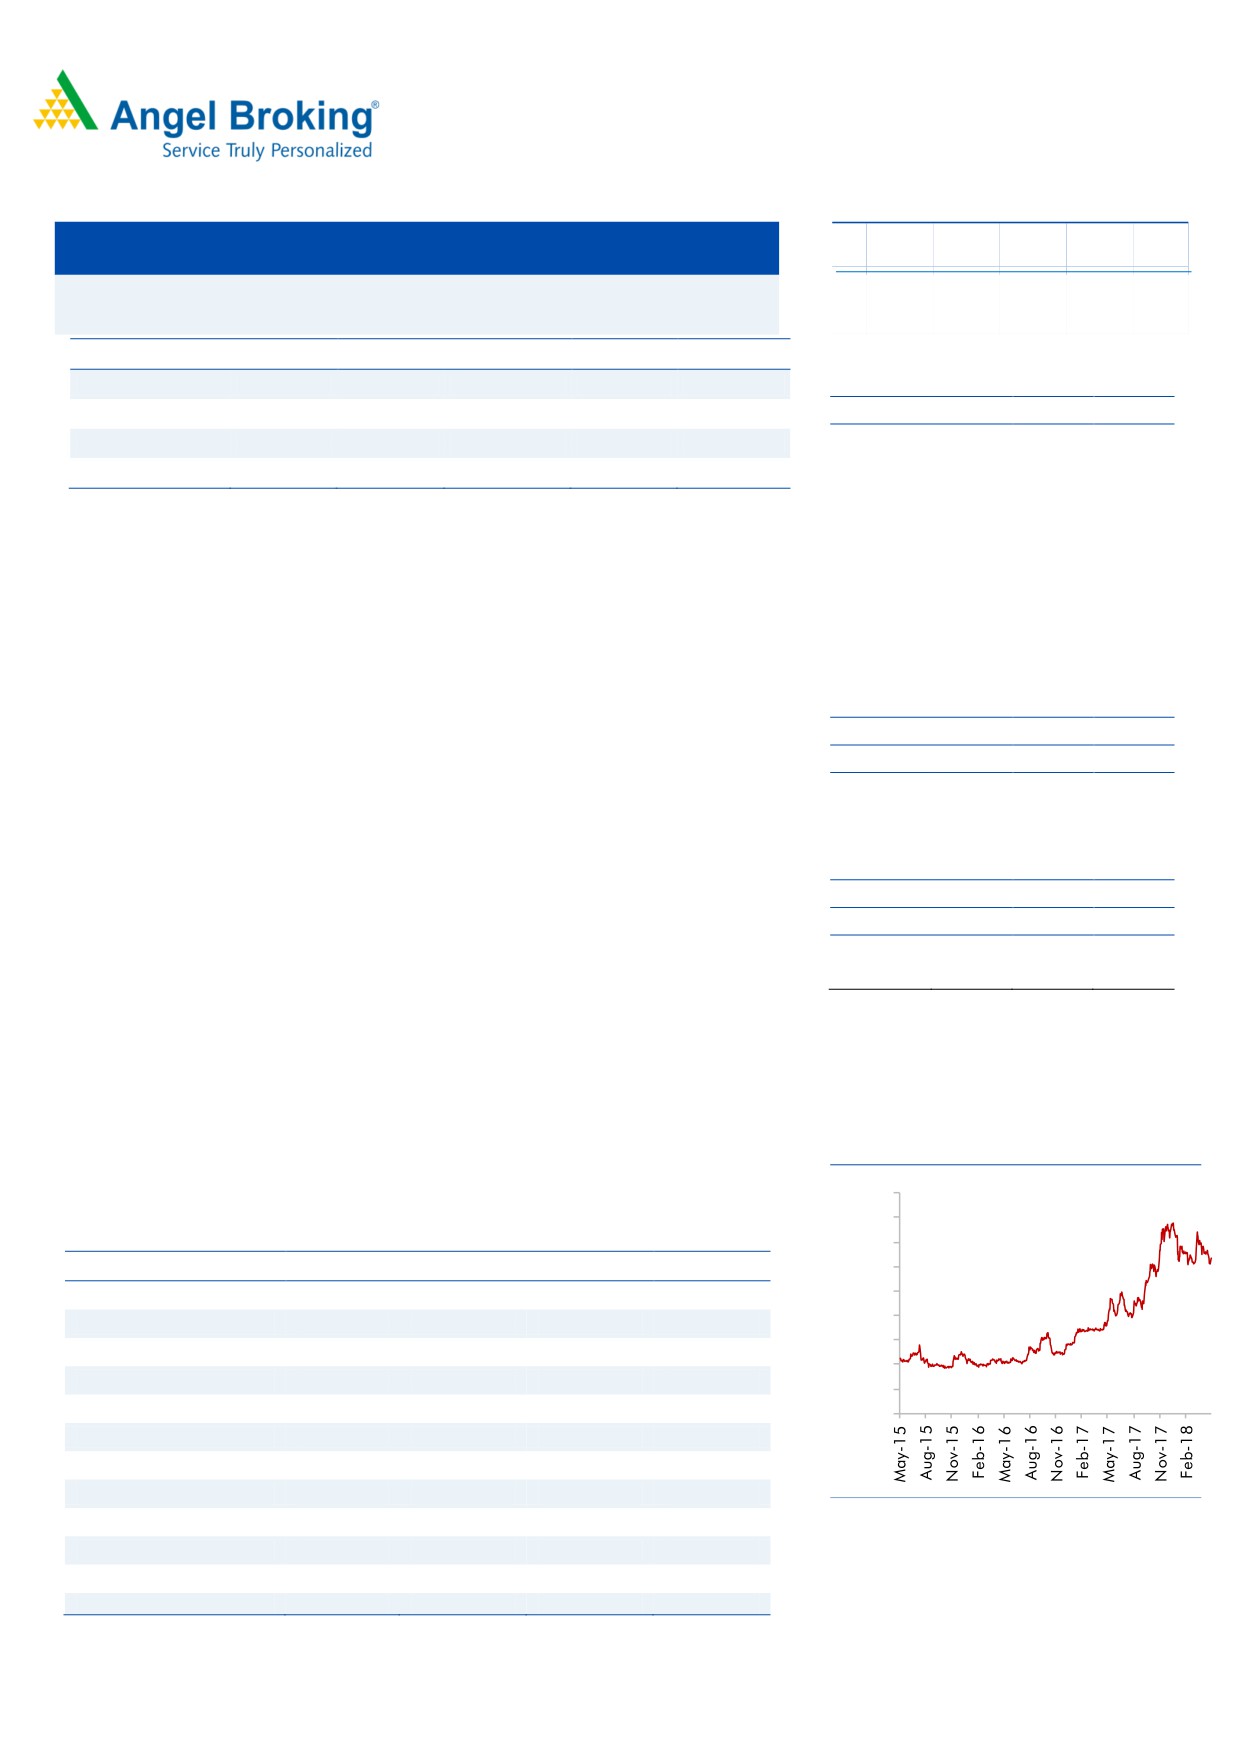
Historical share price chart
CAGR of ~9% to `5,219cr over the same period on the back of margin
improvement. Thus, we recommend BUY on the stock with target price of `1,050.
900
800
Key Financials
700
Y/E March (` cr)
FY2017
FY2018
FY2019E
FY2020E
600
Net sales
44,054
48,686
54,939
62,235
500
400
% chg
7.8
10.5
12.8
13.3
300
Adj. Net profit
3,220
4,046
4,457
5,219
200
% chg
0.4
25.7
10.2
17.1
100
EBITDA margin (%)
10.2
12.8
12.2
12.3
0
EPS (`)
27.1
34.0
37.5
43.9
P/E (x)
32.1
25.5
23.2
19.8
P/BV (x)
4.0
3.6
3.2
2.8
Source: Company, Angel Research
RoE (%)
12.5
14.0
13.8
14.3
RoCE (%)
10.5
15.0
14.4
15.1
Amarjeet S Maurya
EV/Sales (x)
2.0
1.8
1.5
1.3
022-40003600 Ext: 6831
EV/EBITDA (x)
19.2
13.7
12.6
10.7
Source: Company, Angel Research Note
Please refer to important disclosures at the end of this report
1
Mahindra & Mahindra| 4QFY2018 Result Update
Exhibit 1: 4QFY2018 Performance
Y/E March (` cr)
4QFY18
4QFY17
% yoy
3QFY18
% qoq
FY2018
FY2017
% chg
Net Sales
13,308
12,048
10.5
11,578
14.9
49445.0
47383.7
4.4
Consumption of RM
9236.4
9161.83
0.8
8030.6
15.0
34894.1
35411.4
(1.5)
(% of Sales)
69.4
76.0
69.4
70.6
74.7
Staff Costs
706
617
14.4
723
(2.3)
2840.9
2714.4
4.7
(% of Sales)
5.3
5.1
6.2
5.7
5.7
Other Expenses
1,611
1,399
15.2
1,331
21.1
5486.0
4743.3
15.7
(% of Sales)
12.1
11.6
11.5
11.1
10.0
Total Expenditure
11,554
11,178
3.4
10,084
14.6
43,221
42,869
0.8
Operating Profit
1,754
870
101.6
1,494
17.4
6,224
4,515
37.9
OPM
13.2
7.2
12.9
12.6
9.5
Interest
33
48
(31.3)
25
34.0
112.2
159.6
(29.7)
Depreciation
399
427
(6.4)
369
8.1
1479.4
1526.4
(3.1)
Other Income
171
311
98
1036.4
1345.5
PBT (excl. Ext Items)
1,493
706
111.5
1,198
24.7
5,669
4,174
35.8
Ext (Income)/Expense
47.9
93.7
385.8
434
548
PBT (incl. Ext Items)
1,541
800
92.7
1,584
(2.7)
6,102
4,723
29.2
(% of Sales)
11.6
6.6
13.7
12.3
10.0
Provision for Taxation
482
177
368
1746.4
1079.2
61.8
(% of PBT)
31.3
22.2
23.2
29
23
Reported PAT
1,059
622
70.2
1,216
(12.9)
4,356
3,643
19.6
PATM
8.0
5.2
10.5
8.8
7.7
Source: Company, Angel Research
May 30, 2018
2
Mahindra & Mahindra| 4QFY2018 Result Update
Outlook and Valuation
We expect M&M to report net revenue CAGR of ~13% to ~`62,235cr over
FY2018-20E mainly due to healthy growth in automobile segment like Utility
Vehicles (on the back of new launches and facelift of some models) and strong
growth in Tractors segment driven by strong brand recall and improvement in rural
sentiment. Further, on the bottom-line front, we expect CAGR of ~9% to `5,219cr
over the same period on the back of margin improvement. Thus, we recommend
BUY on the stock with target price of `1,050.
Downside risks to our estimates
Strong launches from competitors like Maruti Suzuki, Hyundai Motors and
Ford can grab the market share from M&M
Poor monsoons can impact the overall earnings growth (47% EBIT
contribution from tractors segment)
Lower growth and profitability of subsidiary companies can limit upside
growth
Company Background
Mahindra & Mahindra Ltd (M&M) is an India-based company. The company
operates in nine segments: automotive segment comprises sales of automobiles,
spare parts and related services; farm equipment segment comprises sales of
tractors, spare parts and related services; information technology (IT) services
comprises services rendered for IT and telecom; financial services comprises
services relating to financing, leasing and hire purchase of automobiles and
tractors; steel trading and processing; infrastructure comprising operating of
commercial complexes, project management and development; hospitality
segment comprises sale of timeshare; Systech segment comprises automotive
components and other related products and services, and others segment
comprise s logistics, aftermarket, two wheelers and investment.
May 30, 2018
3
Mahindra & Mahindra| 4QFY2018 Result Update
Profit & Loss Statement
Y/E March (` cr)
FY2017
FY2018
FY2019E
FY2020E
Total operating income
44,054
48,686
54,939
62,235
% chg
7.8
10.5
12.8
13.3
Total Expenditure
39,539
42,462
48,236
54,580
Raw Material
32,082
34,135
38,732
43,875
Personnel
2,714
2,841
3,516
3,983
Others Expenses
4,742
5,486
5,988
6,721
EBITDA
4,515
6,224
6,703
7,655
% chg
(2.3)
37.9
7.7
14.2
(% of Net Sales)
10.2
12.8
12.2
12.3
Depreciation& Amortisation
1,526
1,479
1,644
1,744
EBIT
2,988
4,745
5,059
5,911
% chg
(15.9)
58.8
6.6
16.8
(% of Net Sales)
6.8
9.7
9.2
9.5
Interest & other Charges
160
112
116
122
Other Income
1,894
1,470
1,300
1,300
(% of PBT)
40.1
24.1
20.8
18.3
Share in profit of Associates
-
-
-
-
Recurring PBT
4,723
6,102
6,243
7,089
% chg
10.2
29.2
2.3
13.6
Tax
1,079
1,746
1,785
1,870
(% of PBT)
22.9
28.6
28.6
29.0
PAT (reported)
3,643
4,356
4,457
5,219
Extraordinary Items
423
310
-
-
ADJ. PAT
3,220
4,046
4,457
5,219
% chg
0.4
25.7
10.2
17.1
(% of Net Sales)
7.3
8.3
8.1
8.4
Basic EPS (Rs)
27.1
34.0
37.5
43.9
Fully Diluted EPS (`)
27.1
34.0
37.5
43.9
% chg
0.4
25.7
10.2
17.1
May 30, 2018
4
Mahindra & Mahindra| 4QFY2018 Result Update
Balance Sheet
Y/E March (` cr)
FY2017
FY2018
FY2019E
FY2020E
SOURCES OF FUNDS
Equity Share Capital
297
297
297
297
Reserves& Surplus
25,373
28,529
32,006
36,077
Shareholders Funds
25,670
28,826
32,303
36,374
Total Loans
2,816
2,900
2,900
2,900
Deferred Tax Liability
1,637
1,637
1,637
1,637
Total Liabilities
30,122
33,363
36,840
40,911
APPLICATION OF FUNDS
Gross Block
14,938
15,938
16,938
17,938
Less: Acc. Depreciation
7,303
8,782
10,426
12,170
Net Block
7,635
7,155
6,511
5,768
Capital Work-in-Progress
2,038
2,038
2,038
2,038
Investments
17,902
17,902
17,902
17,902
Current Assets
11,764
15,401
20,064
26,045
Inventories
2,716
3,201
3,913
4,604
Sundry Debtors
2,918
3,468
4,365
5,115
Cash
1,687
2,891
4,094
6,679
Loans & Advances
1,528
2,191
3,296
4,356
Other Assets
2,914
3,650
4,395
5,290
Current liabilities
10,158
9,766
10,308
11,474
Net Current Assets
1,605
5,635
9,755
14,570
Deferred Tax Asset
942
942
942
942
Mis. Exp. not written off
-
-
-
-
Total Assets
30,122
33,363
36,840
40,911
May 30, 2018
5
Mahindra & Mahindra| 4QFY2018 Result Update
Consolidated Cashflow Statement
Y/E March (` cr)
FY2017
FY2018
FY2019E FY2020E
Profit before tax
4639
6102
6243
7089
Depreciation
1327
1479
1644
1744
Change in Working Capital
(31)
(2825)
(2918)
(2229)
Interest / Dividend (Net)
(834)
0
0
0
Direct taxes paid
0
(1746)
(1785)
(1870)
Others
(138)
0
0
0
Cash Flow from Operations
4964
3010
3183
4734
(Inc.)/ Dec. in Fixed Assets
(2060)
(1000)
(1000)
(1000)
(Inc.)/ Dec. in Investments
(1160)
0
0
0
Cash Flow from Investing
(3221)
(1000)
(1000)
(1000)
Issue of Equity
0
0
0
0
Inc./(Dec.) in loans
0
84
0
0
Dividend Paid (Incl. Tax)
(839)
(890)
(981)
(1148)
Interest / Dividend (Net)
(59)
0
0
0
Cash Flow from Financing
(898)
(806)
(981)
(1148)
Inc./(Dec.) in Cash
845
1204
1203
2586
Opening Cash balances
842
1687
2891
4094
Closing Cash balances
1687
2891
4094
6679
May 30, 2018
6
Mahindra & Mahindra| 4QFY2018 Result Update
Key Ratios
Y/E March
FY2017
FY2018
FY2019E
FY2020E
Valuation Ratio (x)
P/E (on FDEPS)
32.1
25.5
23.2
19.8
P/CEPS
20.0
17.7
16.9
14.8
P/BV
4.0
3.6
3.2
2.8
Dividend yield (%)
0.7
0.9
0.9
1.1
EV/Sales
2.0
1.8
1.5
1.3
EV/EBITDA
19.2
13.7
12.6
10.7
EV / Total Assets
2.9
2.5
2.3
2.0
Per Share Data (`)
EPS (Basic)
27.1
34.0
37.5
43.9
EPS (fully diluted)
27.1
34.0
37.5
43.9
Cash EPS
43.4
49.0
51.3
58.5
DPS
6.0
7.5
8.2
9.6
Book Value
215.7
242.2
271.5
305.7
Returns (%)
ROCE
10.5
15.0
14.4
15.1
Angel ROIC (Pre-tax)
33.6
43.4
38.3
40.2
ROE
12.5
14.0
13.8
14.3
Turnover ratios (x)
Asset Turnover (Gross Block)
2.9
3.1
3.2
3.5
Inventory / Sales (days)
22
24
26
27
Receivables (days)
24
26
29
30
Payables (days)
53
49
45
44
Working capital cycle (ex-cash) (days)
(7)
1
10
13
May 30, 2018
7
Mahindra & Mahindra| 4QFY2018 Result Update
Research Team Tel: 022 - 39357800
DISCLAIMER
This document is solely for the personal information of the recipient, and must not be singularly used as the basis of any investment
decision. Nothing in this document should be construed as investment or financial advice. Each recipient of this document should
make such investigations as they deem necessary to arrive at an independent evaluation of an investment in the securities of the
companies referred to in this document (including the merits and risks involved), and should consult their own advisors to determine
the merits and risks of such an investment.
Angel Broking Pvt. Limited, its affiliates, directors, its proprietary trading and investment businesses may, from time to time, make
investment decisions that are inconsistent with or contradictory to the recommendations expressed herein. The views contained in this
document are those of the analyst, and the company may or may not subscribe to all the views expressed within.
Reports based on technical and derivative analysis center on studying charts of a stock's price movement, outstanding positions and
trading volume, as opposed to focusing on a company's fundamentals and, as such, may not match with a report on a company's
fundamentals.
The information in this document has been printed on the basis of publicly available information, internal data and other reliable
sources believed to be true, but we do not represent that it is accurate or complete and it should not be relied on as such, as this
document is for general guidance only. Angel Broking Pvt. Limited or any of its affiliates/ group companies shall not be in any way
responsible for any loss or damage that may arise to any person from any inadvertent error in the information contained in this report.
Angel Broking Pvt. Limited has not independently verified all the information contained within this document. Accordingly, we cannot
testify, nor make any representation or warranty, express or implied, to the accuracy, contents or data contained within this document.
While Angel Broking Pvt. Limited endeavours to update on a reasonable basis the information discussed in this material, there may be
regulatory, compliance, or other reasons that prevent us from doing so.
This document is being supplied to you solely for your information, and its contents, information or data may not be reproduced,
redistributed or passed on, directly or indirectly.
Angel Broking Pvt. Limited and its affiliates may seek to provide or have engaged in providing corporate finance, investment banking
or other advisory services in a merger or specific transaction to the companies referred to in this report, as on the date of this report or
in the past.
Neither Angel Broking Pvt. Limited, nor its directors, employees or affiliates shall be liable for any loss or damage that may arise from
or in connection with the use of this information.
Note: Please refer to the important `Stock Holding Disclosure' report on the Angel website (Research Section). Also, please refer to the
latest update on respective stocks for the disclosure status in respect of those stocks. Angel Broking Pvt. Limited and its affiliates may
have investment positions in the stocks recommended in this report.
Disclosure of Interest Statement
Mahindra & Mahindra
1. Analyst ownership of the stock
No
2. Angel and its Group companies ownership of the stock
No
3. Angel and its Group companies' Directors ownership of the stock
No
4. Broking relationship with company covered
No
Note: We have not considered any Exposure below ` 1 lakh for Angel, its Group companies and Directors
Ratings (Returns):
Buy (> 15%)
Accumulate (5% to 15%)
Neutral (-5 to 5%)
Reduce (-5% to -15%)
Sell (< -15%)
May 30, 2018
8